Mathematical Transformations
Project Overview
Transformations occur everywhere in our lives. It is in the way seed turns into a plant, the way a log in a fireplace turns into a huge flame. Transformations are everywhere, we experience them everyday, but they also occur in math. A transformation in math is a rule or a function that could simply be an "In-Out" table. The "In" value would be transformed into an "Out" value, the "In" value is the input x and "Out" is the output y. The purpose of this project was to investigate a mathematical transformation based on our hobbies and interests. Through the data we collected, we must determine the functions of our experiments, then put these functions on display in a creative way at our exhibition.
Transformations occur everywhere in our lives. It is in the way seed turns into a plant, the way a log in a fireplace turns into a huge flame. Transformations are everywhere, we experience them everyday, but they also occur in math. A transformation in math is a rule or a function that could simply be an "In-Out" table. The "In" value would be transformed into an "Out" value, the "In" value is the input x and "Out" is the output y. The purpose of this project was to investigate a mathematical transformation based on our hobbies and interests. Through the data we collected, we must determine the functions of our experiments, then put these functions on display in a creative way at our exhibition.
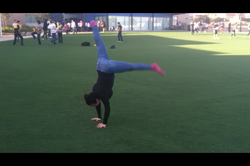 Emily Chung preforming a cartwheel
My partner for this project was Natalie Au, and after trying to come up with many ideas, we finally decided on studying the mathematical transformations of cartwheels. We chose to do cartwheels because it was an easy experiment to control, like the amount of cartwheels done or the time, and was an easy way to obtain data quickly in the time that was given. For this experiment, we had two volunteers, Emily Chung and Bonnie May, who kindly did the experiment for us while we observed and collected our data. We had to create two experiments to show linear and non-linear functions. For our first experiment, we observed the amount of cartwheels done in a certain amount of time.
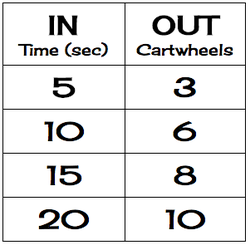
This "In-Out" table is for our first experiment in which our volunteer, Emily Chung, preformed as many cartwheels as she could in the given time. The time we gave was 5, 10, 15 and 20 seconds to see how many cartwheels could be done. Emily preformed 3 cartwheels in 5 seconds, 6 cartwheels in 10 seconds, 8 cartwheels in 15 seconds, and 10 cartwheels in 20 seconds. I timed the experiment and Natalie Au wrote down the data, while Natalie Boyle assisted us in filming the project. Once our data was collected, Natalie and I analyzed the data and put it in a math program known as GeoGebra. GeoGebra takes the data and creates a graph to show if the data is linear or non-linear. So when our data was put into GeoGebra, we saw that the line was approximately linear.
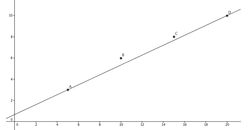
The graph shown shows a line going through two of the points that represent our data. The other two points are very close to this line to show that this function is approximately linear. This line is approximately linear because the points on the graph are either very close to the line or are on the line. The data in the "In-Out" table show that the output is approximately half of the input. Therefore, when the data is graphed, the function is approximately linear.
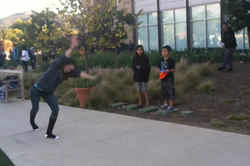 Bonnie May preforming a cartwheel
For our second experiment, we wanted to see how long it takes to do a certain amount of cartwheels. Our volunteer, Bonnie May, preformed this experiment for us while I wrote down the data and Natalie Au filmed. This experiment is our non-linear function, so we attempted to create a function that would not be linear.
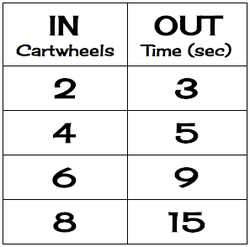
This "In-Out" table is for our second experiment. We gave the task of doing 2, 4, 6, and 8 cartwheels to Bonnie May, our volunteer. So the cartwheels were the input and the output was the time. Bonnie took 3 seconds to do 2 cartwheels, 5 seconds for 4 cartwheels, 9 seconds for 6 cartwheels, and 15 seconds for 8 cartwheels. We plotted the points on GeoGebra to see if it was linear or non-linear. This data was non-linear when we graphed the line on the program.
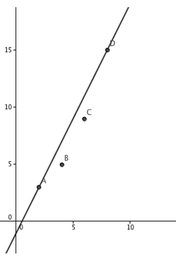
This is the graphed data for our second experiment. As you can see in the graph, the points seem curve upwards. That is because this line is a representation of exponential growth and is obviously non-linear. Even though two of the points are somewhat close to line, this would not be considered linear because of the curving fashion of the points. In the "In-Out" table, there is somewhat a pattern, but the growth of the table is too high to actually have a linear pattern. For example, the difference between 3 and 5 is 2, the difference between 5 and 9 is 4, and the difference between 9 and 15 is 6. This shows the exponential growth in the table and in turn shows on the graph.
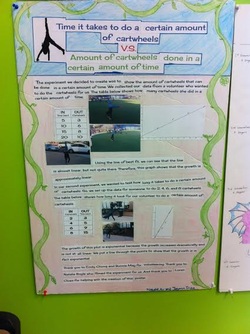
Natalie and I were originally going to put a bunch of pictures and a caption on a poster then explain it during exhibition, but, with the help of Dr. Drew, we decided to create an info graphic. When we created the info graphic, we decided to make it look as nice as possible. We used a vine as our border and typed up all the captions and titles so it was eligible. We added some pictures from the experiment, the "In-Out" tables, and the graphs. Our inspiration came from actually making a small info graphic on the computer and then transferring the ideas onto a poster to create a large scale of an info graphic.
Project Reflection
Natalie and I worked very well on this project, since we are compatible and are able to listen to each other's ideas. This project was very interesting and was surprisingly easy. It was very interesting to see the transformation of different things in a mathematical way. The actual experiment went very well because it was very easy and fun to gain the information we need. Even though the project was easy, I would change how the creative piece was presented because I think we could have come up with a much more creative way to present our data than posting it on a poster board. A Habit of a Mathematician that I think I used successfully was collaborate and listen because I shared some of my ideas to help see what we should investigate for his project, but when it came to my partner I would step back to listen to her ideas. A habit that I didn't really use, but could've used more was stay organized. The past benchmarks were organized, but when it came to the poster, I think we could've made it more organized because the information seemed to be all over the place. Overall, this was a very interesting project and quite fun when it came to the experimenting portion. I did enjoy the experimenting part of this project and think that we need more of this in our math projects.
Natalie and I worked very well on this project, since we are compatible and are able to listen to each other's ideas. This project was very interesting and was surprisingly easy. It was very interesting to see the transformation of different things in a mathematical way. The actual experiment went very well because it was very easy and fun to gain the information we need. Even though the project was easy, I would change how the creative piece was presented because I think we could have come up with a much more creative way to present our data than posting it on a poster board. A Habit of a Mathematician that I think I used successfully was collaborate and listen because I shared some of my ideas to help see what we should investigate for his project, but when it came to my partner I would step back to listen to her ideas. A habit that I didn't really use, but could've used more was stay organized. The past benchmarks were organized, but when it came to the poster, I think we could've made it more organized because the information seemed to be all over the place. Overall, this was a very interesting project and quite fun when it came to the experimenting portion. I did enjoy the experimenting part of this project and think that we need more of this in our math projects.
