For the math portion of the exhibition, we took a look at the statistics of all the different issues that were discussed in our Symposium. At the beginning of the project, we created a financial plan about how much we would have to pay for college and what scholarships we would get to lower the cost. After finishing our college plan, we learned about savings and taxes, and had to create a short term savings plan, a mid-term plan, and a long-term plan. When we figured out how much we wanted to save and for what, we moved onto budgeting our lives. We looked for an entry job specific to our major and tried to budget a life off of the beginning salary. This had to be budgeted by the month to calculate in the payments for taxes, insurance, student loans, food, transportation, mortgage or rent, and housing bills (water, electricity, etc.) This taught us how to be wise with our money and how to spend it on necessary things first before buying excess.
The next part to the math portion was to choose an ideal minimum wage. After choosing $15, I had to budget the life of someone living on minimum wage. This process was meant to show us the financial situation of many people living in the United States, which was very eye opening. It was difficult to budget it out, so I decided to add on a husband to get double the minimum wage. Then, to make it even more difficult, a random number of children was assigned to each student. I had three children to factor into my budget, and even after including a second source of income, I was in debt for almost $300. Doing this helped us learn how families in the U.S. are living off of minimum wage.
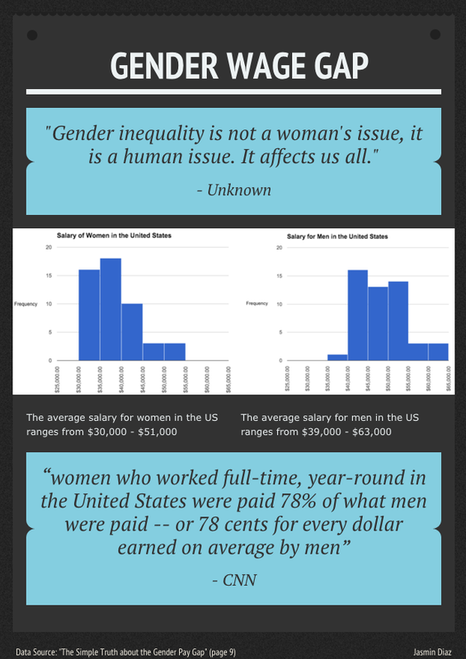
We learned about exponential growth and decay like compounding interest. For example, compound interest on a loan. As the time of having the loan increases, the amount of interest increases. I learned how to calculate how much interest I would have to pay on the loans in my budget which I also had to factor in. Logarithms was another math concept we learned about. I caught onto logarithms quite quickly and was able to understand how to use the different equations and how to calculate it all out. We also learned about the "Statistical Problem Solving Process" which is four steps. First, you plan and ask a question that can be answered with data, then you collect the data, analyze it, and then interpret the results. I used this when looking at the gender wage gap. I formulated a question about how much women are affected by the wage gap, collected the data, interpreted the results, and turned it into a histogram, box plot, and scatter plot. During this project, I learned about the box plot which I didn't know much before. I used what I learned about the four step plan when taking in the gender wage gap data and used it to create graphs.
For the symposium, we had to create infographics based on our topic of research and data. My infographic is about the gender wage gap.
The next part to the math portion was to choose an ideal minimum wage. After choosing $15, I had to budget the life of someone living on minimum wage. This process was meant to show us the financial situation of many people living in the United States, which was very eye opening. It was difficult to budget it out, so I decided to add on a husband to get double the minimum wage. Then, to make it even more difficult, a random number of children was assigned to each student. I had three children to factor into my budget, and even after including a second source of income, I was in debt for almost $300. Doing this helped us learn how families in the U.S. are living off of minimum wage.
We learned about exponential growth and decay like compounding interest. For example, compound interest on a loan. As the time of having the loan increases, the amount of interest increases. I learned how to calculate how much interest I would have to pay on the loans in my budget which I also had to factor in. Logarithms was another math concept we learned about. I caught onto logarithms quite quickly and was able to understand how to use the different equations and how to calculate it all out. We also learned about the "Statistical Problem Solving Process" which is four steps. First, you plan and ask a question that can be answered with data, then you collect the data, analyze it, and then interpret the results. I used this when looking at the gender wage gap. I formulated a question about how much women are affected by the wage gap, collected the data, interpreted the results, and turned it into a histogram, box plot, and scatter plot. During this project, I learned about the box plot which I didn't know much before. I used what I learned about the four step plan when taking in the gender wage gap data and used it to create graphs.
For the symposium, we had to create infographics based on our topic of research and data. My infographic is about the gender wage gap.
For all the work I did in math, click the links below.
