Mathematical Model of Me
The project, Mathematical Model of Me, is basically about describing what makes us as individuals, what makes us unique. The question "Who are you?" can be answered in many ways, like name, likes, dislikes, hopes, hobbies and sports. The purpose of this project is to answer the question "Who are you?" in a mathematical perspective of the mathematical model of me. We must represent ourselves in our creation for people to get an idea about us. Our job was to create an image of something that represented us (in my case a horse) in a program called GeoGebra. It creates a model out of a collection of coordinate points on a coordinate plane, which will then create a series of line segments to form a picture of your artifact.
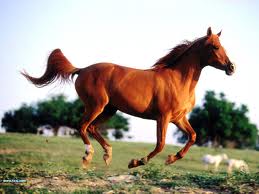
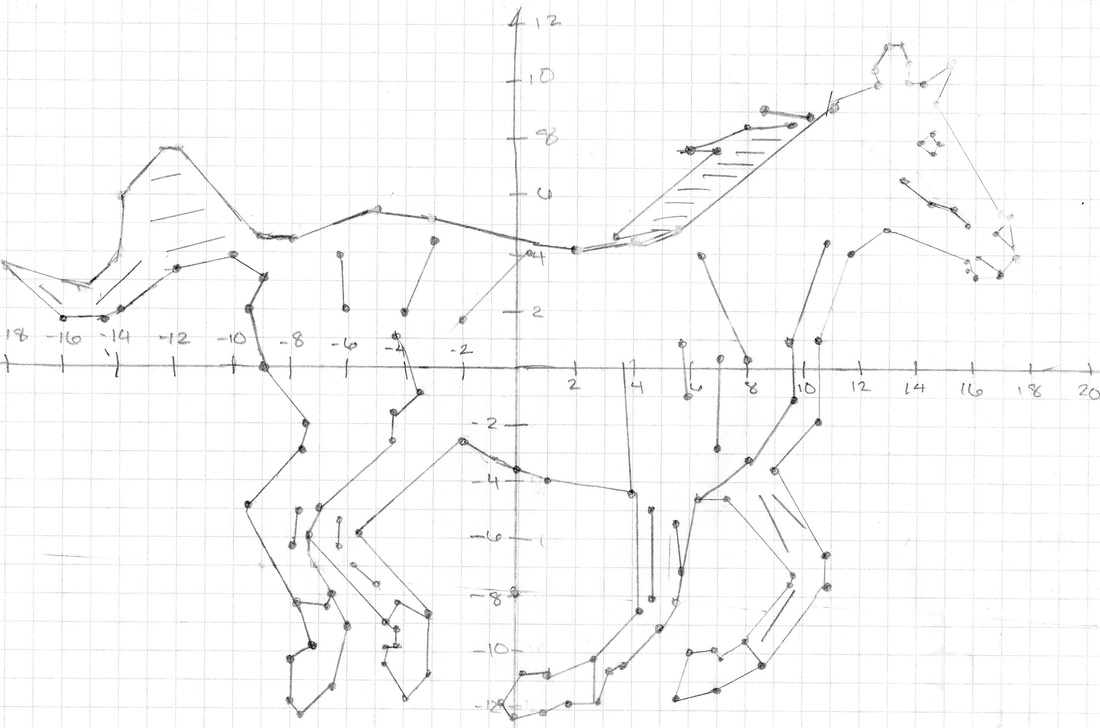
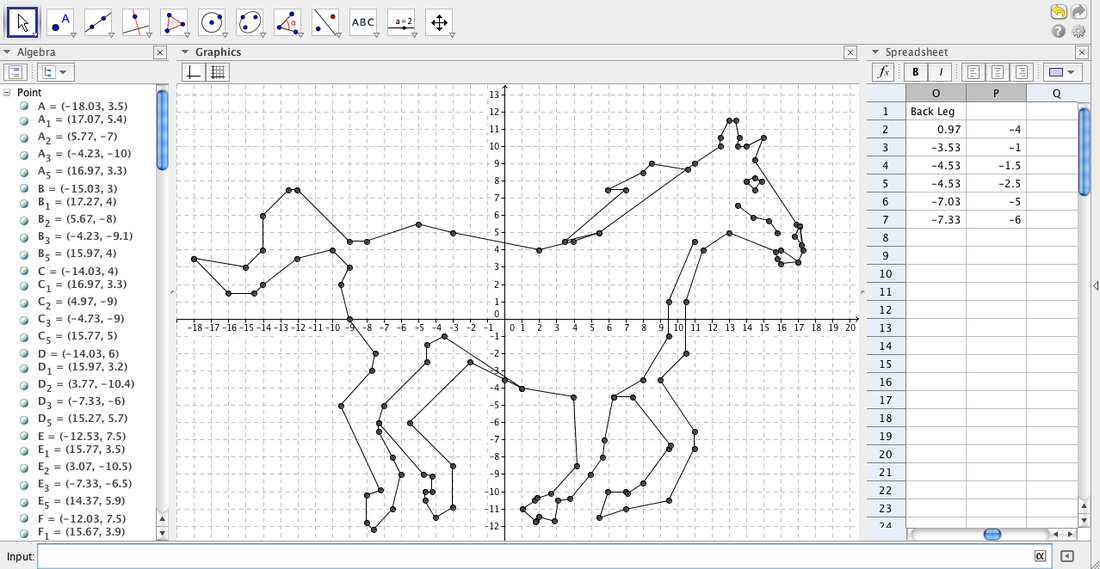
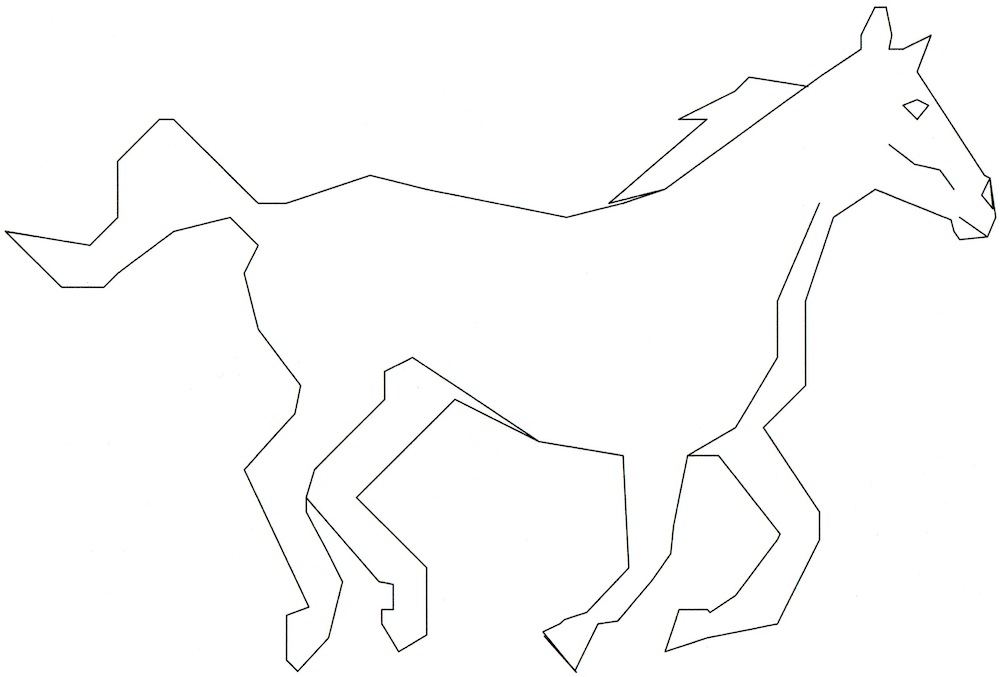
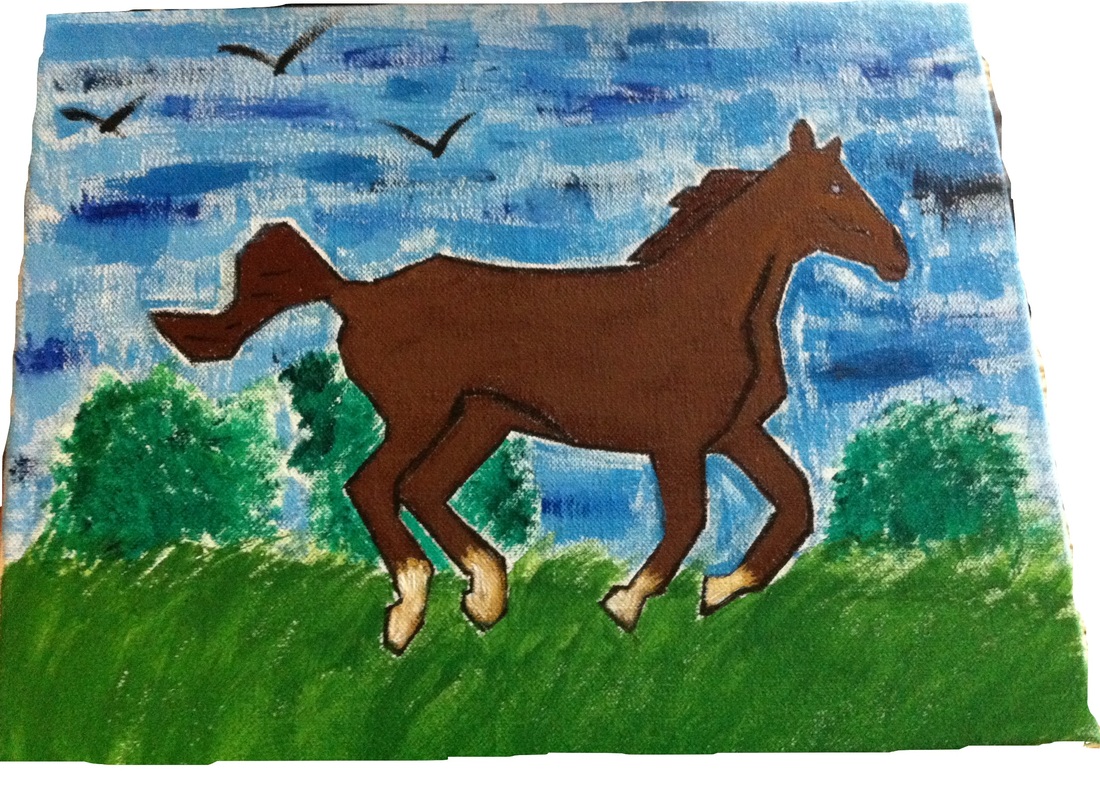
One of my favorite animals is a horse, a golden-brown horse to be exact like in the above picture, so I chose my picture of a running horse easily. I thought a picture of a horse running would be more challenging than a horse standing still. My picture is important to me because it is really attached to my childhood, I have loved horses since I was very young, and they are very beautiful creatures. Once my picture was chosen, I had to graph it on a piece of graph paper and find my scale. Once we figured out our scale, we plotted our coordinate points on GeoGebra. GeoGebra is a mathematical program where you may create polylines and plot points. In GeoGebra after we plotted our points, we had to use the polyline tool. The polyline tool is used to create a whole picture by connecting all the points together with line segments on an x- and y- axis. An x- and y- axis is also known as a coordinate plane. To make sure the picture was proportioned correctly, we had to use the aspect ratio to make the ratio 1:1. Our pictures are plotted in an area of GeoGebra known as the graphics view. The graphics view is the area where you can see the polyline that has been created on the coordinate plane. The spreadsheet view is where you first insert the coordinate points of the picture that is being created. Once I inserted the points into the spreadsheet view, I highlighted all my points and clicked the polyline button. This created my picture of the horse. I export my picture by resizing the image and getting rid of the axis and grid. To export my picture, I click File, go under export and click Graphics View as Picture (png, eps) and save it to the desktop of my computer. This helped me create the mathematical model of me painting as seen in the last picture.
Essential Questions
1. What is a mathematical model? A mathematical model is a form of art that takes a picture and models it mathematically. It is also describes a system by using mathematical language.
2. How can complex imagery be modeled mathematically? Complex imagery can be modeled mathematically by simplifying the picture down to the main lines that creates the basic shape of the image. In other words, you can simplify the picture to the basics.
3. How can productivity software be used for graphing? By inputing data from equations or research into any productivity software, like excel or GeoGebra, you can formulate graphs and view trends/patterns.
